As the guest article below by economist Gale Pooley makes clear, a happy, badly needed revolution is coming to the dismal world of economics: We are actually progressing more—and faster—than we realize. Policies need to reflect this inspiring reality. Guest post by Gale L.
Pooley Sir David Attenborough , the face and voice of many BBC programs said, “Anyone who believes in indefinite growth on a physically finite planet is either mad or an economist. ” That would make me and my co-author, Dr. Marian Tupy, mad economists.
Economics is not about the number of atoms on a finite planet; economics is about knowledge, and knowledge has no physical limits. Indeed, as Thomas Sowell has observed, “The cavemen had the same natural resources at their disposal as we have today, and the difference between their standard of living and ours is a difference between the knowledge they could bring to bear on those resources and the knowledge used today. ” Look around and you will see the growth of knowledge, or the “intelligizing” of atoms in the products we enjoy every day.
George Gilder enlightens us with three propositions: Wealth is knowledge, growth is learning, and money is time. From these propositions we can derive a theorem: The growth of knowledge can be measured with time. Imagine waking up this morning and finding everything on sale for 75.
2% off. For the price of one, we now get more than four. We are more than 300% better off.
In fact, this is what happened from 1980 to 2020 when we looked at the average “time prices” of 50 basic commodities including energy, food, materials, minerals and metals. What is a time price? It’s the amount of time it takes to earn the money to buy something. Money prices are expressed in dollars and cents, and time prices are expressed in hours and minutes.
We can easily convert a money price to a time price by dividing the money price by hourly income. For example, if a pizza costs $20 and you are earning $20 an hour, the time price of a pizza is one hour. If the price increases to $25 and your income increases to $30 an hour, the time price is now 50 minutes.
The time price decreased by 16. 7%. Now for the same amount of time you get 20% more pizza.
Using time instead of money to measure our standard of living reveals a world of increasing prosperity. For the time it took our grandparents to earn the money to buy one refrigerator in 1956, we can buy 13 today. For the time it took our great grandparents to buy a bicycle one hundred years ago, we can buy 22 today.
For the time it took blue-collar workers to buy one pound of sugar in 1850, they can buy 227 today. Innovation occurs when we create, discover and share valuable knowledge. Our analysis of hundreds of products, some dating back to 1850, indicates that personal abundance is increasing around 3% to 4% a year.
This might not seem like much, but what it means is that abundance doubles every 20 years or so. If you are 60, you are eight times richer than the day you were born. Elon Musk raised eyebrows at a recent Wall Street Journal CEO Council event when he remarked, “I think one of the biggest risks to civilization is the low birth rate and the rapidly declining birth rate, yet so many people—including smart people—think that there are too many people in the world and think that the population is growing out of control.
It’s completely the opposite. Please look at the numbers. If people don’t have more children, civilization is going to crumble.
Mark my words. ” Maybe the world’s richest entrepreneur and father of ten was talking about Thanos? The Infinity War villain murders half of life in the universe because he believes in the same ideology as Sir David Attenborough. We can also use time prices to measure global resource abundance.
Global resource abundance is equal to personal resource abundance multiplied by population. Recall that from 1980 to 2020 the average time price of 50 basic commodities fell by 75. 2%.
For the price of one, we now get 4. 03, a 303% increase. During the same time, global population increased by 75.
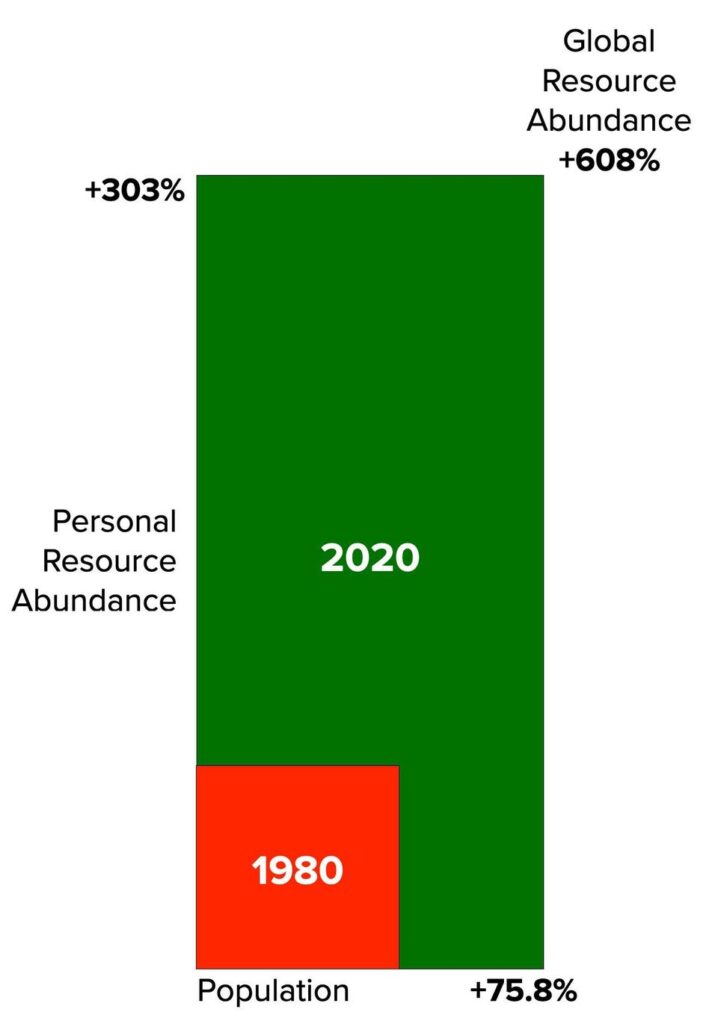
8%. The following chart illustrates the difference in global resource abundance between 1980 and 2020. The red box is indexed to a value of one and represents 1980.
The green box is 2020. From 1980 to 2020 personal resource abundance increased by 303%, while population grew by 75. 8%.
Overlaying the red box on the green box shows the 608% difference in global resource abundance [(4. 03 x 1. 758) – 1].
Global resource abundance has been growing at a 5% compound annual rate, doubling abundance every 14 years. Watch this short video that explains the red-green box chart. Also note that every 1% increase in population corresponded with a 4% increase in personal resource abundance (303% divided by 75.
8%) and an 8% increase in global resource abundance (608% divided by 75. 8%). When Alexandria Ocasio-Cortez asks if it’s “OK to have children,” we can answer with an absolute yes! There has never been a better time to create human beings.
Each new person brings the potential to lift us all with their unique gifts and talents and discoveries. If Thanos had thought like Elon Musk and looked at the astonishing resource abundance numbers, instead of destroying half of humanity’s knowledge-creating ability, he would have used the infinity stones to fill our universe with human life. —Gale L.
Pooley, associate professor of economics at Brigham Young University-Hawaii; co-author with Marian Tupy of Superabundance: The Story of Population Growth, Innovation, and Human Flourishing on an Infinitely Bountiful Planet (Cato Institute, on sale August 31, 2022).
From: forbes
URL: https://www.forbes.com/sites/steveforbes/2022/08/25/measuring-the-abundance-of-an-infinitely-bountiful-planet/
