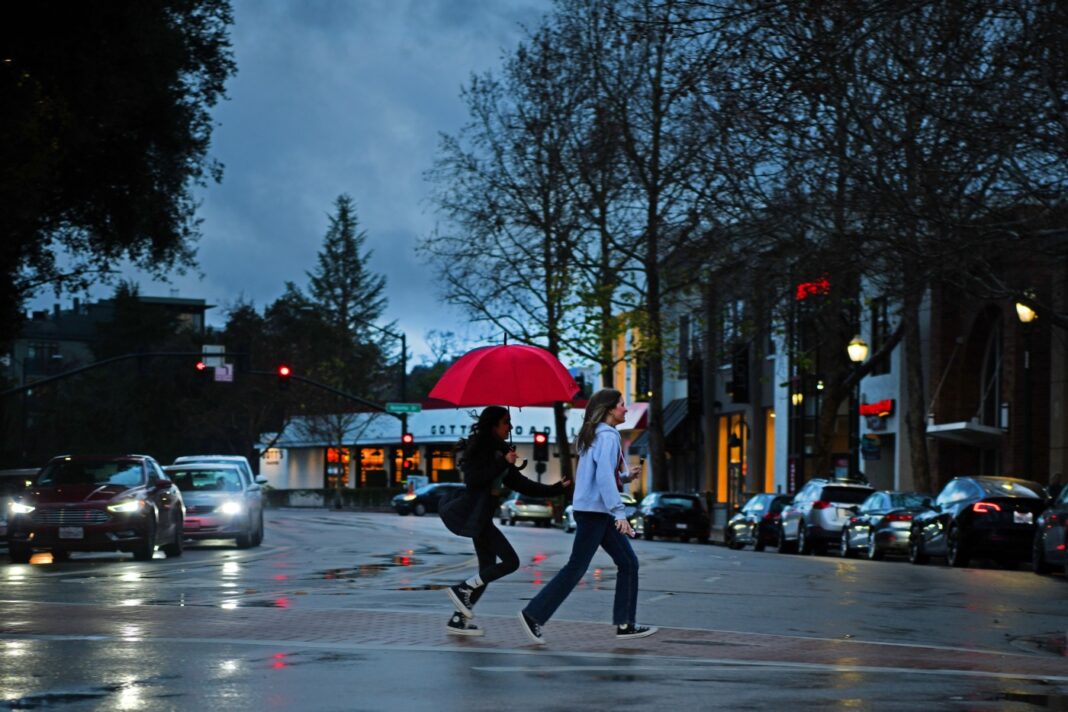
Propelled by big storms in January and March, the past 12 months ended up ranking as the wettest in 17 years in the Bay Area, and wetter than 92% of years back to the Gold Rush. That was the final tally on Friday, as the official “rainfall season” used by many meteorologists came to an end. With downtown San Francisco as a marker for Bay Area weather because it has the oldest continuous daily records in California, the year that began last July 1 and ended Friday was the 14th wettest over the past 174 years, with 34.
19 inches of rain falling. That’s well above the historical average of 21. 78 inches back to 1849, and it was more than enough to smash the state’s three-year drought, as a parade of atmospheric river storms dumped huge amounts of snow in the Sierra Nevada, filled reservoirs and caused flooding in some areas.
While this year in the Bay Area was wetter than nine out of 10 years, on average, in recorded California history, other years in the not-too-distant past including 2005-06, 1997-98, and 1982-83 were even wetter. “It was a great year,” said meteorologist Jan Null of Golden Gate Weather Services in Half Moon Bay, who compiled the statistics. “But it wasn’t the greatest.
” This winter’s deluge peaked right after Christmas. From Dec. 26 to Jan.
15, a staggering 17 inches of rain fell in downtown San Francisco — five times the historical average and more rain than any person alive had experienced in the Bay Area over any three-week period. The only wetter three-week period came during the Civil War when a drowning 23. 01 inches fell in San Francisco from Jan.
5 to Jan. 25, 1862, in a winter that became known as “The Great Flood of 1862. ” Other California locations saw similar year-end rainfall totals.
Over the past 12 months, San Jose experienced its 12th wettest year since records began in 1893, with 21. 88 inches. And Los Angeles had is 8th wettest year since records began there in 1877, with 28.
4 inches. In fact, since Jan. 1, for the first time in 25 years famously wet Seattle has received less rain than San Francisco and Los Angeles for the first half of a year.
The past year proved that an old adage about California water is often wrong — that it is impossible to end a deep drought in one year. “We have a lot of variability in precipitation in California,” said Jay Lund, a professor of civil and environmental engineering at UC Davis. “It can change real fast.
We went from a pretty significant drought to a moderately significant flood year in a span of a few months. ” The winter storms dumped the most snow in the Sierra Nevada — the source of nearly one-third of California’s water supply — in 40 years. All that snow has delayed fire season.
And it prolonged ski season. Most Lake Tahoe-area ski resorts stayed open an additional two or three weeks longer than normal, into late April and early May. One, Palisades Tahoe, which received 60 feet of snow this year, remains open for skiing until July 4.
The rain sent reservoirs from dangerously low levels to brimming. Shasta, the state’s largest reservoir, near Redding, was 94% full on Friday. Oroville, the second largest, in Butte County, was 99% full.
Folsom northeast of Sacramento was 95% full, and San Luis Reservoir between Gilroy and Los Banos was 97% full. Groundwater in many areas across the state also recovered back to pre-drought levels, although in parts of the Central Valley where overpumping by farmers has continued for decades, it is far from recovered. The big rain and snow totals also brought a rare phenomenon: The recurrence for only the fourth time since the 1960s of Tulare Lake, an area that was historically underwater near Bakersfield but drained by settlers and farmers in the late 1800s, only to reappear every few decades when huge winter snows and rains deliver water to the area.
But fears of disaster in the Tulare Basin did not appear. Mild spring weather without major heat waves allowed Southern Sierra snows to melt at a moderate pace. Levees and sandbags protected nearby towns like Corcoran.
This week, the state Department of Water Resources reported that the temporary lake had begun to shrink in size as the weather warms. 1) 1861-1862 — 49. 27 inches 2) 1997-1998 — 47.
22 inches 3) 1889-1890 — 45. 85 inches 4) 1867-1868 — 38. 84 inches 5) 1982-1983 — 38.
17 inches 6) 1981-1982 — 36. 63 inches 7) 1957-1958 — 36. 48 inches 8) 1852-1853 — 35.
26 inches 9) 1877-1878 — 35. 18 inches 10) 1940-1941 — 35. 05 inches 11) 1866-1867 — 34.
92 inches 12) 2005-2006 — 34. 42 inches 13) 1972-1973 — 34. 36 inches 15) 1994-1995 — 34.
02 inches 16) 1849-1850 — 33. 10 inches 17) 1885-1886 — 33. 05 inches 18) 1951-1952 — 32.
56 inches 19) 2016-2017 — 32. 34 inches 20) 1883-1884 — 32. 32 inches * 174-year average — 21.
78 inches Source: National Weather Service / Golden Gate Weather Services.
From: mercurynews
URL: https://www.mercurynews.com/2023/06/30/california-weather-how-this-year-ranks-among-the-all-time-biggest-rainfall-years/


